HubSpot to Google Data Studio Reporting for CRM Teams

You can connect a HubSpot portal to Google Data Studio through OAuth in under two minutes. That establishes the data connection, but how reliably reports refresh depends on the method you use to bring data in.
A quick connection is only the starting point. CRM teams also need reports that clearly reflect the pipeline, align marketing and sales metrics, and handle customer data carefully. When connecting HubSpot to Google Data Studio, decide how data will refresh, which metrics to combine, and how to organize reports around the questions your team needs to answer.
This guide covers connection methods, data refresh and access, and ways to visualize sales, marketing, and service performance. It also explains how to align reporting with your CRM processes, so teams can act on shared information instead of reconciling disconnected views.
Key Takeaways
- Choose a data refresh approach that fits how current your reports need to be; manual CSV uploads require repeating the export and upload process.
- Build pipeline views around deal stages, values, and movement so sales teams can spot where opportunities need attention.
- Bring CRM, advertising, and website analytics together to connect campaign activity with deals and customer outcomes.
- Set up HubSpot data access and reporting around clear team needs, consistent definitions, and appropriate data permissions.
Data security and automatic refresh
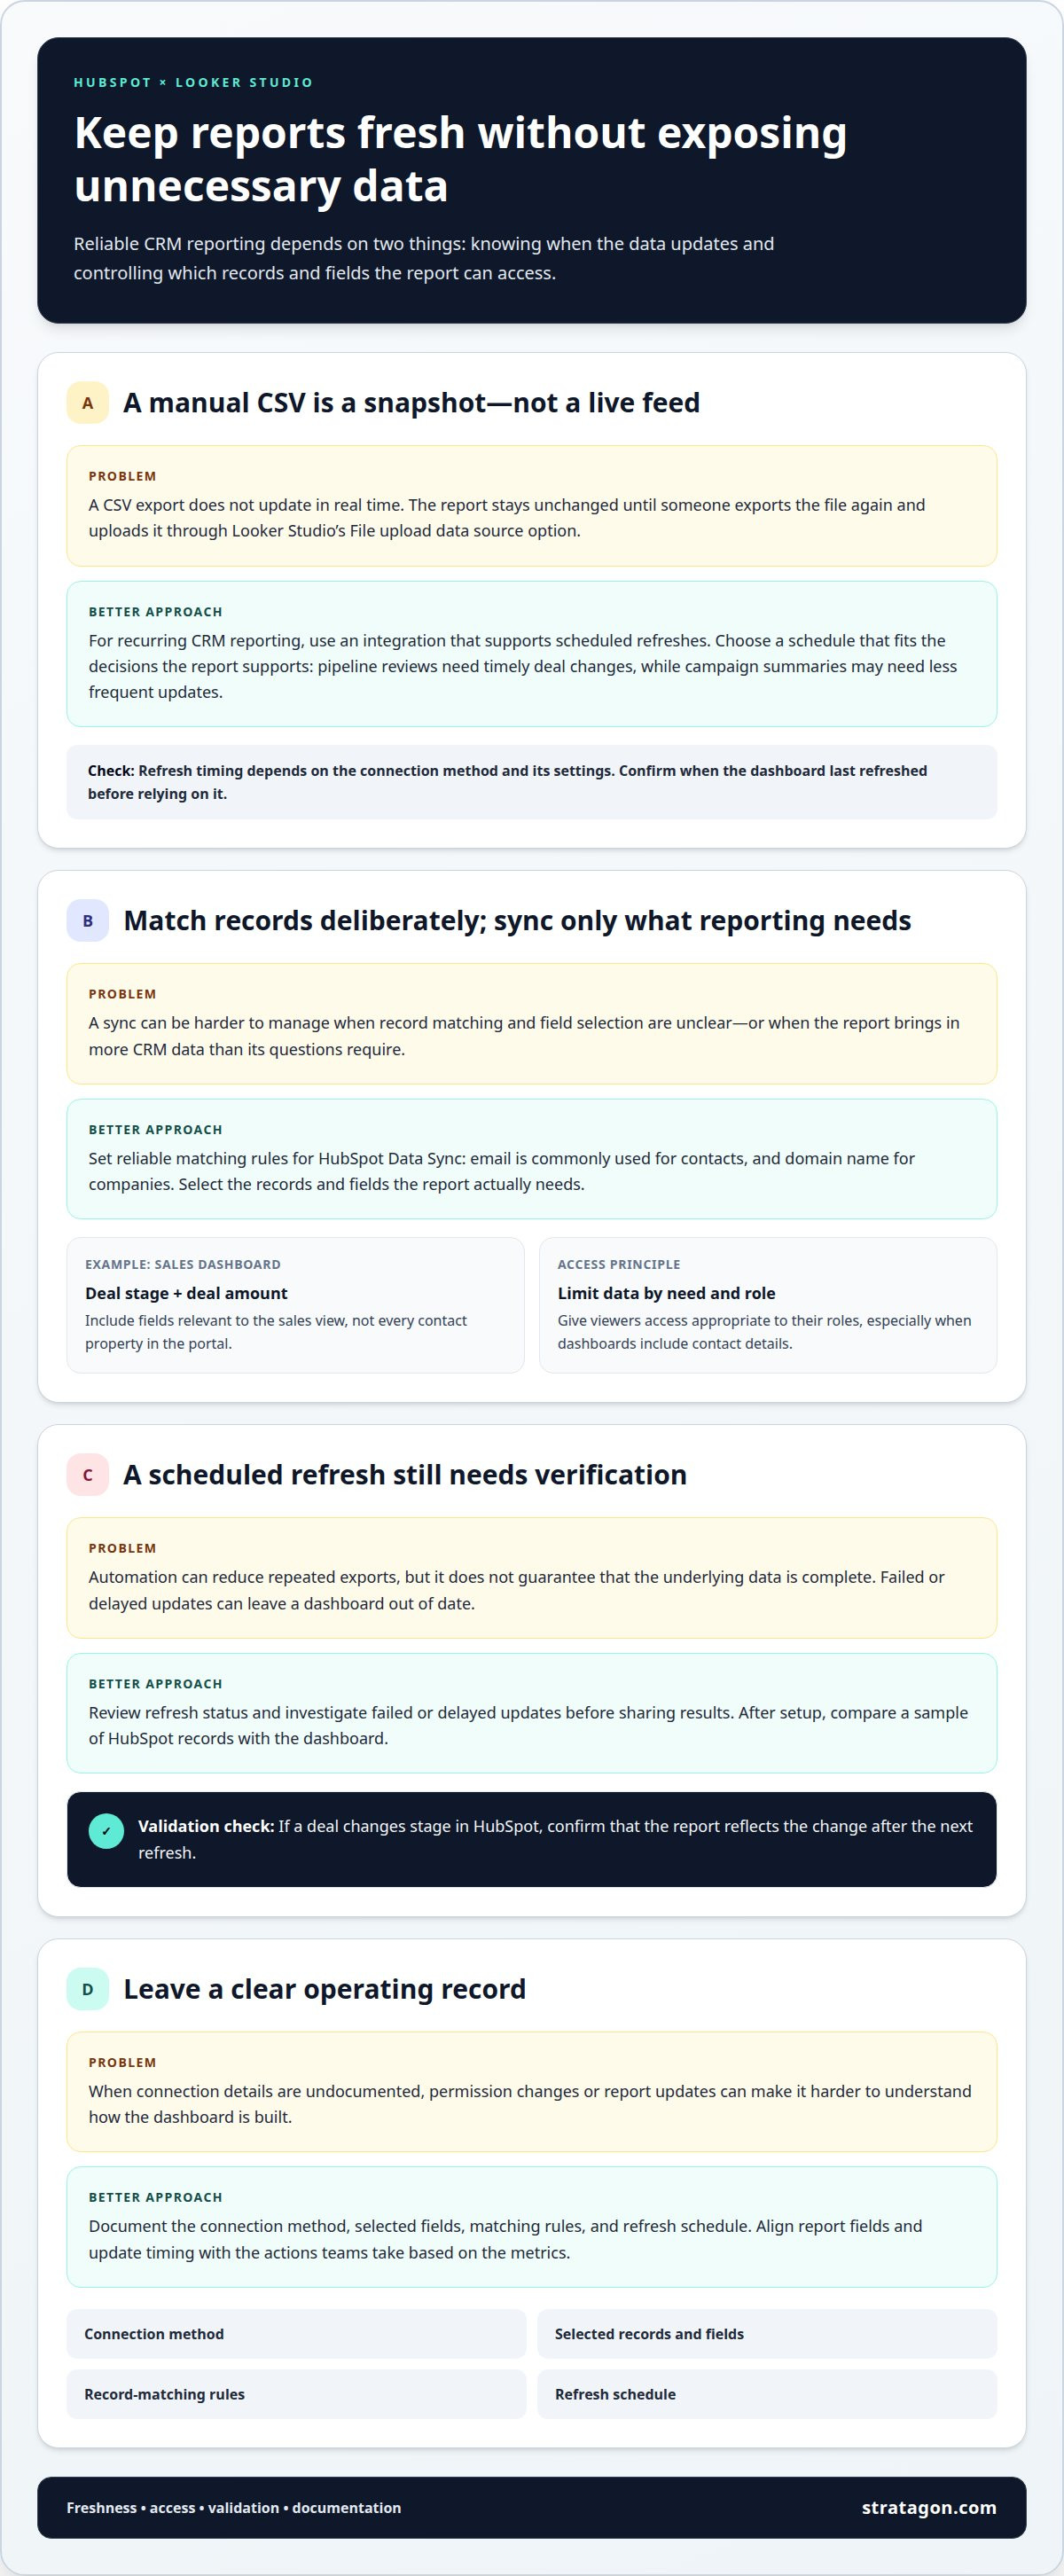
Connecting HubSpot to Google Data Studio means planning for both data access and freshness. A manual CSV export is a snapshot, not a live feed. It does not update in real time, so someone must export the file again and upload it through Looker Studio’s File upload data source option. Until then, reports may show older information.
For recurring CRM reporting, use an integration that supports scheduled refreshes. Set the schedule to match the decisions the report supports: pipeline reviews need timely deal changes, while campaign summaries may need less frequent updates. The available schedule depends on the connection method and its settings. Before relying on a dashboard, confirm when it last refreshed.
HubSpot Data Sync also needs a reliable way to match records between systems. Email is commonly used to match contacts, and domain name to match companies. Before syncing, choose the records and fields the report actually needs. For instance, a sales dashboard may need deal stage and amount, but not every contact property in the portal.
- Limit access to the HubSpot records and fields needed for reporting.
- Give report viewers access appropriate to their roles, especially when dashboards include contact details.
- Review the refresh status and investigate failed or delayed updates before sharing results.
These controls make automated CRM reporting easier to understand and manage. Scheduled refreshes can reduce repeated exports, but they do not replace checking that the underlying data is complete. After setup, compare a sample of HubSpot records with the dashboard. If a deal changes stage in HubSpot, confirm that the report reflects it after the next refresh.
Document the connection method, selected fields, matching rules, and refresh schedule. This gives CRM administrators a clear reference when permissions change or reports need updating. For marketing automation workflows, align report fields and update timing with the actions teams take based on the metrics. A dashboard should support decisions without exposing unrelated data.
With a manual transfer, the report stays unchanged until someone repeats the export process. It does not update in real time, so its freshness depends on another manual refresh.
Sales pipeline and deal reporting
A useful pipeline report shows deal progress, not just a total. Start with the questions sales leaders need answered: which stages contain active opportunities, what value sits in each stage, and which deals need attention? Build the report around those decisions, using HubSpot deal properties that your team maintains consistently.
For example, a stage breakdown can show deal count and total value by pipeline stage. Add a table with deal name, owner, stage, and close date so sales representatives can identify specific follow-ups. Managers can use owner or pipeline filters to review team activity separately. Keep stage names consistent with HubSpot, so the report reflects the CRM process instead of creating a second interpretation.
Customer acquisition reporting adds context to pipeline performance. Compare new deals with the channel or campaign information recorded in HubSpot, and define consistently what counts as an acquired customer. A report can show how many deals reach closed-won status alongside their associated values. Use the same date field across charts when comparing periods; different date fields can produce conflicting views.
To create the report in Looker Studio, follow a deliberate sequence:
- Choose the HubSpot data source and add the deal fields needed for the questions.
- Create a table for individual opportunities and a chart grouped by stage.
- Add filters for owner, pipeline, or date range, based on how the team reviews performance.
- Compare totals with HubSpot records and refine labels before sharing.
Keep operational details separate from leadership summaries. A sales representative may need deal-level follow-up fields, while an executive view can emphasize stage totals and closed-won value. Clear labels, consistent filters, and aligned definitions help both views tell the same revenue story. Review the report when HubSpot stages or sales processes change, so the visualizations continue to match the team’s workflow.
Visualizing marketing, sales, and customer service metrics
A shared Looker Studio dashboard can connect marketing activity with HubSpot sales outcomes and service workload. Start by defining the decisions each team needs to make. Marketing may track campaign response, sales may monitor sourced deals, and customer service may review ticket volume or status. Use clear metric definitions so “new customer” means the same thing across reports.
For attribution, teams can compare campaign data with sales outcomes to explore how marketing activity relates to revenue. This lets teams examine which traffic sources produce revenue. A customer acquisition dashboard can also combine HubSpot, Google Ads, and GA4 data in one Looker Studio report. Align campaign names across systems before blending, or inconsistent labels can split related activity into separate rows.
A HubSpot marketing performance dashboard can organize results by campaign, source, and lifecycle stage. Pair lead or contact counts with associated deal counts, then compare performance over the same reporting period. For marketing-to-sales funnel reporting, show how records move from initial engagement to qualified opportunity and closed-won deal. Confirm that lifecycle stages and deal outcomes reflect your team’s process.
Include email performance in the same decision framework, but keep its measures distinct from revenue attribution. For example, display email sends, opens, clicks, and associated contacts alongside campaign or lifecycle data where those fields are available. This helps teams assess engagement without treating a click as a sale. A trend chart can show changes across campaigns, while a table can help identify specific email activity.
Customer service views can add ticket counts by status, category, or assigned team. Keep service measures separate from acquisition metrics, then connect them through shared customer records when the reporting question requires it. Before sharing, check that chart filters apply consistently across HubSpot, Google Ads, and GA4 data sources. A practical dashboard review asks whether each chart supports an action, such as adjusting campaign investment, refining handoffs, or prioritizing open tickets.
Keep the UTM campaign field central when comparing deal outcomes with GA4 sessions. This relationship frames source analysis around revenue-linked deals, rather than session activity alone. A shared join key gives the review a consistent basis for examining campaign contribution and connecting traffic sources to deal results.
Connecting HubSpot as a Google Data Studio data source
Google Data Studio, now called Looker Studio, needs a data source to visualize HubSpot records. The connection method determines whether teams upload snapshots or use a connector to access CRM data. An OAuth portal connection takes under two minutes, but setup speed is only one consideration. Field selection, refresh behavior, and reporting needs all matter.
To test a report, export HubSpot data as a CSV file and upload it through Looker Studio’s File upload data source option. This lets you choose sample fields and check chart layouts. It is a manual snapshot, so changed records will not appear until someone exports and uploads a new file. Use it to prototype, not as a source of current reporting.
A connector-based setup can reduce repeated file handling and support recurring reports. Before connecting, identify the HubSpot objects and properties the report needs, such as contacts, companies, or deals. Authorize the portal, select the relevant fields, and confirm that the values appear as expected. Start with a focused dataset: unnecessary properties can complicate report design and access decisions.
How do connector options compare for pricing, features, and ease of use? CSV upload is easy to test but requires manual replacement. An OAuth connector can streamline access, but its features and refresh controls depend on the specific option. Choose based on the reporting workflow, not setup speed alone.
How much do HubSpot-to-Looker Studio connectors cost? Costs depend on the connector and your requirements, including data scope, refresh needs, and additional sources. Compare these factors with the time and reporting effort the connection needs to support.
Use this sequence to validate the data source:
- Choose the connection method that matches your reporting needs.
- Authorize the HubSpot portal or upload a prepared CSV file.
- Select required properties and build a test chart in Looker Studio.
- Compare sample values with HubSpot before sharing the report.
The key decision is whether a manual snapshot meets your reporting needs or a connector better supports ongoing analysis. Test the selected fields and report behavior before building dashboards around them.
CSV upload is the simplest way to test a report. An OAuth connector may suit recurring reporting better by reducing repeated file handling. Compare the specific connector’s features and refresh controls, then weigh its cost against your data scope and reporting needs.
Stratagon: HubSpot CRM Implementation
Stratagon can help when HubSpot data structure, team workflows, and reporting requirements need to work together. Its HubSpot CRM Implementation service helps organizations refine how records, properties, and processes support sales and marketing decisions. This is a natural next step when dashboards reveal inconsistent definitions, disconnected handoffs, or fields that teams maintain differently.
For example, a reporting setup may require marketing and sales to agree on lifecycle stages, deal properties, and ownership rules before charts can provide a shared view. Stratagon also offers digital transformation and Sales Enablement to support broader operational change and practical team adoption when CRM processes need to evolve.
If your reporting goals call for a more aligned HubSpot setup, contact Stratagon or visit stratagon.com.
Make reporting part of how your teams move forward
Connecting HubSpot to Google Data Studio is most valuable when teams use reports to make decisions, not simply review dashboards. Treat the setup as an ongoing practice: assign ownership for metric definitions, align teams on how to interpret results, and revisit the questions reports should answer as priorities change. This keeps data connected to the work it is meant to support.
When your CRM structure or team workflows need a stronger foundation, Stratagon can support the next step through HubSpot CRM Implementation and digital transformation. Its Account-Based Marketing (ABM) offering can also help align marketing and sales around shared account priorities. The goal is to bring systems, processes, and business objectives together.
Bring your reporting goals and CRM priorities into a practical conversation. Contact Stratagon about HubSpot reporting, and take the next step toward clearer, more aligned decisions.
Frequently Asked Questions
How do HubSpot connector options compare for pricing, features, and ease of use?
CSV upload is easy to test but requires manual replacement. An OAuth connector can streamline access, though its features and refresh controls depend on the specific option.
How much do HubSpot to Looker Studio connectors cost?
Costs depend on the connector and your requirements, including data scope, refresh needs, and additional sources.