How to Build Custom Sales Analytics Reports in HubSpot for Your Team

Building custom sales analytics reports in HubSpot starts with choosing the sales outcome you need to measure, then selecting CRM data, filters, and a visualization that makes the results clear. Custom reporting tools can bring together data from one record type or across related records, with measures chosen to fit the analysis. The strongest reports connect activity and pipeline signals to decisions your team can act on.
It’s easy to end up with a dashboard full of numbers that don’t answer the questions sales leaders and representatives actually have. A focused reporting approach keeps metrics relevant, definitions consistent, and performance discussions grounded in shared data.
This guide covers practical steps for reporting on sales activity, pipeline performance, forecasts, quota achievement, and marketing results. Learn how to choose useful metrics, organize reports around your sales process, and bring key views together in HubSpot dashboards.
Key Takeaways
- Use sales activity and outcome metrics together to see whether calls, emails, meetings, and follow-ups are translating into opportunities and closed deals.
- Break pipeline performance down by owner and deal type to spot stage-conversion issues, changing deal velocity, and patterns in wins or losses.
- Bring pipeline value, forecasts, and quota attainment into a shared view so sales leaders can assess progress and prioritize action.
- Connect funnel and marketing performance reporting to understand how prospects move toward becoming customers and which channels contribute to that journey.
Sales metrics for custom dashboards
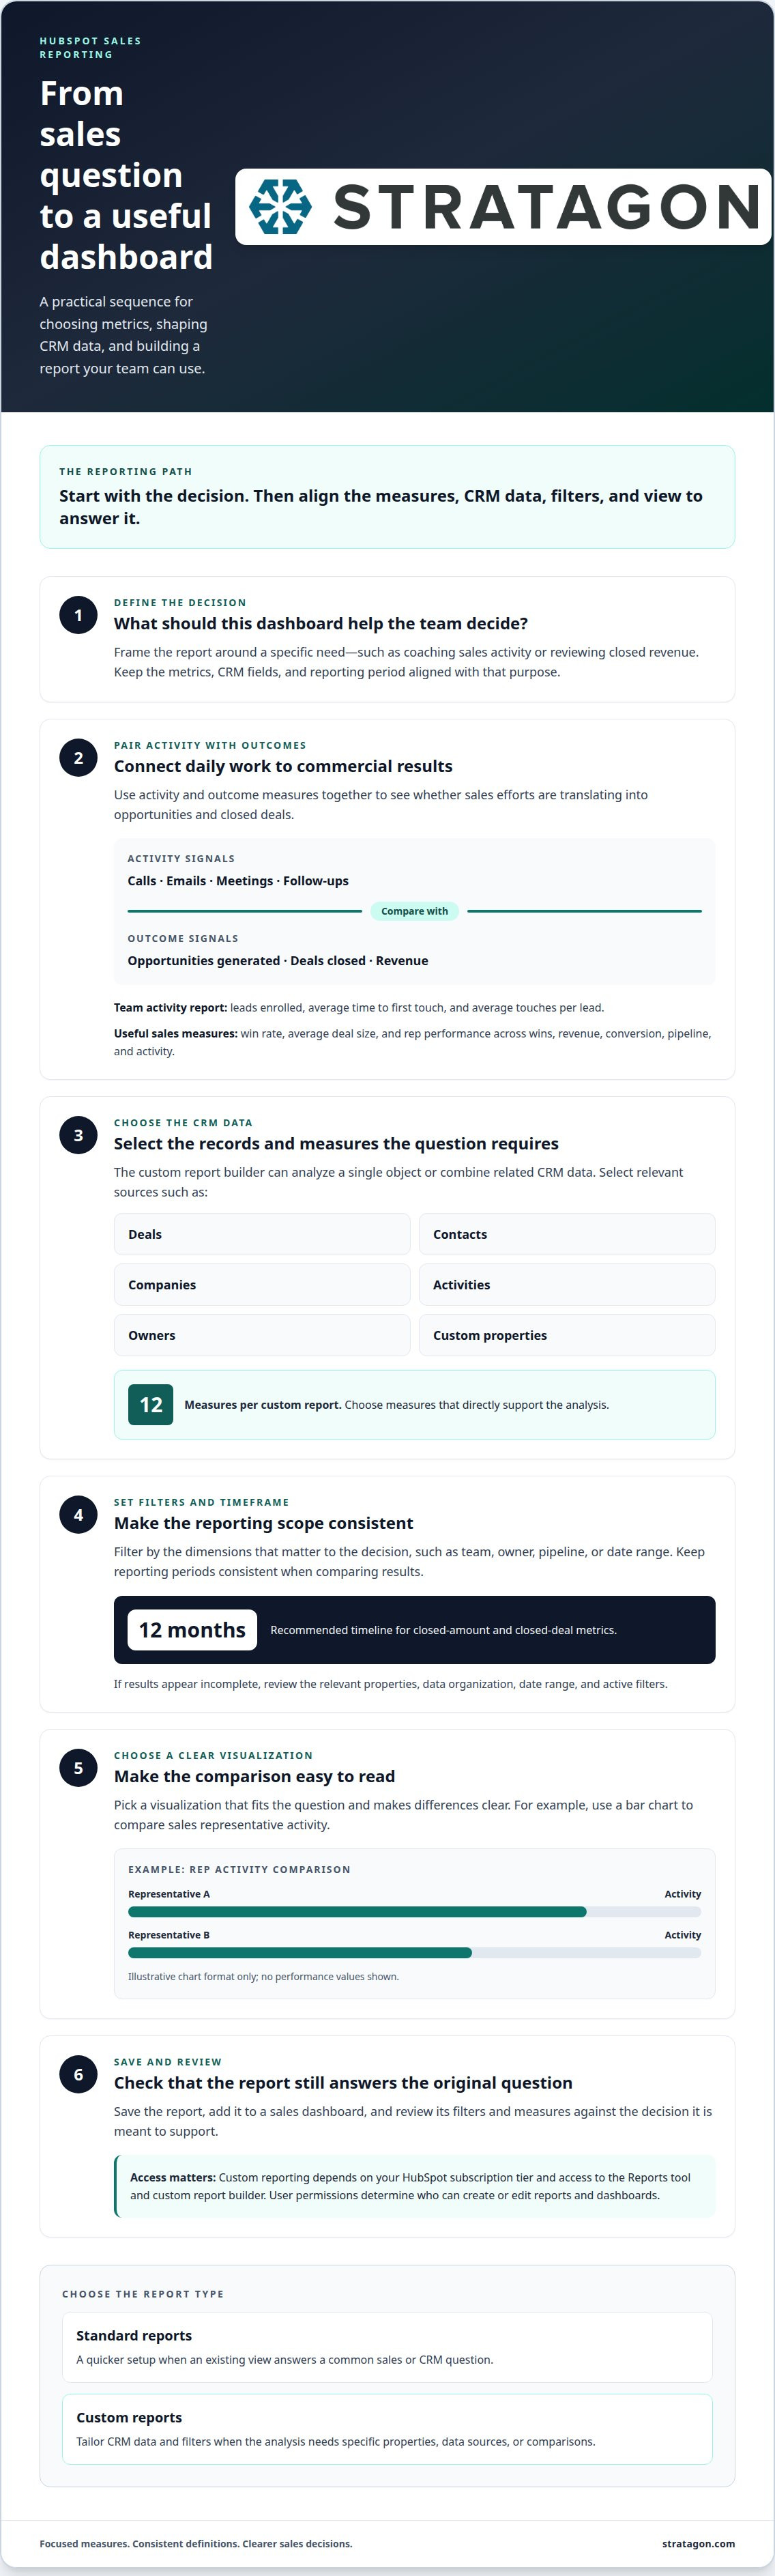
Start with the decision each dashboard should support, such as coaching activity or reviewing closed revenue. Building custom sales analytics reports in HubSpot is most effective when the metrics, CRM fields, and reporting period all align with that decision.
Select Sales Dashboard Metrics and KPIs
Choose sales metrics that connect daily activity to commercial outcomes. For example, pair calls, emails, meetings, and follow-ups with opportunities generated or deals closed. HubSpot’s Team activity report includes leads enrolled, average time to first touch, and average touches per lead.
- Track win rate to measure the share of opportunities converted into customers.
- Include average deal size to understand revenue generated from closed deals.
- Use sales rep performance reports to compare wins, revenue, conversion, pipeline, and activity.
- Set a consistent reporting period; recommended closed-amount and closed-deal metrics use a 12-month timeline.
Create Dashboards and Add Custom Reports
Build the dashboard around a clear question, then add reports that answer it. HubSpot’s custom report builder can analyze single-object and cross-object CRM data, including deals, contacts, companies, activities, owners, and custom properties. Custom reports can include up to 12 measures.
Available custom reporting features depend on your HubSpot subscription tier. Standard reports cover common sales and CRM needs, while the custom report builder supports tailored analysis. Building custom sales analytics reports in HubSpot requires access to the Reports tool and custom report builder. User permissions determine who can create or edit reports and dashboards.
- Select relevant CRM data sources, then apply filters for team, owner, pipeline, or date range.
- Choose a visualization that makes comparisons clear, such as a bar chart for rep activity.
- Save the report, add it to a sales dashboard, and review whether its filters and measures support the intended decision.
For questions that require an individual contact view, HubSpot users can search marketing email activity for a specific contact. This adds context when reviewing a contact alongside sales measures, while keeping the dashboard focused on its broader purpose. Treat that activity as a point of investigation, not proof of what caused a deal outcome, and consider it alongside relevant CRM fields and the reporting period.
Sales pipeline analysis by owner and deal type
Standard reports answer common sales questions and are quicker to set up, while custom reports let you tailor CRM data and filters. Create a report by selecting data, filters, and a visualization, then save, schedule, or share it through HubSpot’s report controls. If data is missing, review properties, filters, and data organization.
-
Choose Between Custom and Standard Reports
Use a standard report when its existing view answers your pipeline question. Choose a custom report when you need to compare deal owners, deal types, or CRM properties in one analysis. Select the relevant data sources, apply filters, and choose a visualization. Make sure the fields match your sales process, so a missing property doesn’t skew comparisons.
-
Analyze Deal Outcomes, Sources, and Stalled Deals
Segment deals by owner, deal type, source, and outcome to identify where wins and losses concentrate. Review loss reasons alongside deal size, industry, and sales representative; these dimensions can show whether a pattern reflects deal fit or execution. To flag stalled deals, use a deal risk score dataset. HubSpot’s example adds 20 risk points when a close date has been pushed three or more times, and assigns a score of 0 to Closed Won or Closed Lost deals.
-
Measure Deal Velocity and Sales Cycle Length
Compare stage changes and elapsed time to see how opportunities progress. Deal velocity measures how quickly deals move through the pipeline; sales cycle length measures the average time it takes to close opportunities. Break down both measures by owner or deal type. Then review stage conversion rates to find slow transitions and identify where follow-up or process changes may help.
-
Filter Reports by Deal Amount
Apply deal amount filters to isolate opportunities relevant to a decision, such as larger deals or a defined value range. Compare filtered results by owner, stage, and outcome to see whether high-value deals advance or stall differently. Keep filter logic consistent across reports. If results look incomplete, first review the amount property, date range, and other active filters.
When inconsistent CRM properties or pipeline definitions undermine these comparisons, HubSpot CRM implementation support can align the data structure with your sales reporting needs.
Sales forecasts and quota achievement
Use HubSpot sales dashboards to connect expected revenue with team targets and forecast decisions. Build each view around consistent deal stages, owners, and reporting periods.
- First, define the forecast question: assess expected team revenue, compare individual progress, or identify gaps against quota. A useful dashboard can include pipeline value, deal win rate, sales cycle duration, quota achievement, and sales forecasts. Keep the reporting scope consistent so leaders compare like with like across owners and teams.
- Include weighted pipeline to estimate expected revenue based on each deal’s probability. Compare it with the unweighted pipeline to distinguish total potential from probability-adjusted expectations. Review stage and owner breakdowns together. A large pipeline may support a forecast, but stage mix and deal progress shape its likely contribution.
- Build quota attainment reports around progress toward individual or team sales targets. Pair the target with closed revenue for the same reporting period, then segment by sales owner. This view helps leaders see who is on pace and where coaching or a pipeline review may help. Align the period and quota definitions before comparing results.
- Build a forecast view that shows the inputs behind expected revenue. Include deal amount, stage, close date, owner, and probability when those CRM fields support the analysis. Filter out deals outside the chosen period, and review close dates alongside stage movement. A forecast is more actionable when users can trace its totals back to the underlying deals.
- Review forecasts against actual outcomes as deals close or change stages. Compare shifts in weighted pipeline, quota progress, and win rate to see whether gaps relate to deal timing, conversion, or pipeline coverage. Use the dashboard in regular sales reviews and assign follow-up actions to the relevant owner. Consistent definitions help managers distinguish a temporary timing change from a broader performance trend.
Sales funnel and marketing performance dashboards
Start with the business question, then connect funnel stages to marketing activity. HubSpot dashboards bring reports together in one place, helping sales and marketing teams review related performance signals.
- Map the funnel stages you want to measure, from lead to opportunity to customer. A lead-to-customer conversion report follows that progression, while a pipeline-by-stage report shows potential revenue at each deal stage. Use both views to spot where prospects stop advancing and where pipeline value accumulates.
- Build reports around the outcome each team can influence. For example, pair channel-level website visitors with lead conversion and deal progression. HubSpot’s marketing performance dashboard shows website visitors by channel over the last 6 months. Compare that traffic view with sales outcomes to understand how marketing activity aligns with the pipeline.
- Use HubSpot custom reports to tailor data sources, filters, properties, calculations, and visualizations. Sales data from tools integrated through the HubSpot App Marketplace can also inform reports when shared with HubSpot. Keep field definitions consistent across sales and marketing so teams interpret channel, lead, and deal results in the same way.
- Choose a suitable report format before adding it to a dashboard. Custom reports with more than 99 values in the Break down by property cannot display on dashboards and must be viewed in the reports tool. For marketing email engagement, build a list of contacts who clicked a specific email or review activity on an individual contact. The custom report builder cannot create a contacts-by-clicked-email matrix.
Connecting campaign activity with sales outcomes takes a well-defined funnel and reliable CRM data. Marketing automation can help strengthen that reporting connection.
A HubSpot custom report lets sales representatives examine CRM data by selecting data, applying filters, comparing metrics, and analyzing trends. They can use those choices to focus an analysis on relevant data, compare selected metrics, and inspect trends in the CRM information. This flexible examination can help keep attention on the question the report is intended to address.
A lead-to-customer conversion report follows prospects from lead through opportunity creation to closing as a customer. Following those steps in sequence keeps the conversion path in view, from the prospect’s initial lead stage through opportunity creation and customer closing. Consider this progression alongside custom report analysis: one traces the stated path to a customer, while the other allows representatives to select and compare CRM data.
Stratagon: HubSpot CRM Implementation
Stratagon helps teams align HubSpot CRM structure with the sales reports they need to guide decisions. Turn to HubSpot CRM Implementation when inconsistent properties, pipeline stages, or reporting definitions make performance difficult to interpret. The work connects CRM setup with practical reporting needs, helping sales leaders assess pipeline health, forecast progress, and team activity using shared definitions.
For teams focused on adoption, Sales Enablement can connect reporting practices with how representatives manage opportunities. Clear processes help teams record useful data and apply insights in sales reviews. When reporting challenges span systems, workflows, and team alignment, digital transformation can address the broader operating context.
Contact Stratagon to discuss how HubSpot CRM Implementation can support your sales analytics goals.
Turn Sales Data Into Your Next Growth Decision
The next step is to make reporting part of how your organization sets priorities, allocates resources, and adapts its sales process. Building custom sales analytics reports in HubSpot becomes more valuable when leaders treat measurement as an ongoing operating practice, not a dashboard project that ends at launch. Revisit which decisions your reports support as teams, campaigns, and revenue goals evolve.
Stratagon can connect HubSpot CRM Implementation with broader digital transformation priorities, helping teams align systems and reporting practices. Account-Based Marketing (ABM) can also bring sales and marketing together around strategically important accounts. The right foundation supports the way your people work and the decisions your business needs to make.
Contact Stratagon to discuss your sales reporting goals and identify a practical next step. With clear priorities and connected data, your team can move forward with greater focus and confidence.
Frequently Asked Questions
HubSpot custom report builder limitations by subscription tier
Available custom reporting features depend on your HubSpot subscription tier. Standard reports cover common sales and CRM needs, while the custom report builder supports tailored analysis.
How to schedule and share HubSpot sales analytics reports
Use HubSpot’s report controls to schedule or share a report after building it. You can also save the report and add it to a sales dashboard.